Forecasting methods for Google Sheets

Forecast and marketing data are sometimes difficult to match up. Forecast can be scary as we are never that comfortable to rely solely on it. I’m sharing with you some valuable techniques based on my proven experience; ran on Google Sheets. No hard skills needed.
At first, when I was asked for a SEO traffic forecast, I would use the Holt-Winters method using R Studio to run my forecast (forecasting with Holt-Winters). As the time flies, it became irrelevant to exclusively rely on it. Plus, it was difficult to explain the method as well as sharing the code itself as it requires a specific setup and, at least, knowing how to run an R script. So, definitely not the best idea to share my forecast to my manager.
Start by forecasting the past
As odd as it might seem, instead of using lots of data and sometimes tortuous code, I started by forecasting the past. I manage both the paid and organic acquisition at Pictarine and I was first asked to forecast our marketing expenses for the month to come. I decided to only select a few data to start with:
- Real spend from the month before.
- Real spend from the month minus 1 year to get an idea of the trend / seasonality.
I then opened a new file on Google Sheets are started by using the linear forecast formula:
=FORECAST.LINEAR(A2,'dummy spend data'!B:B,'dummy spend data'!A:A)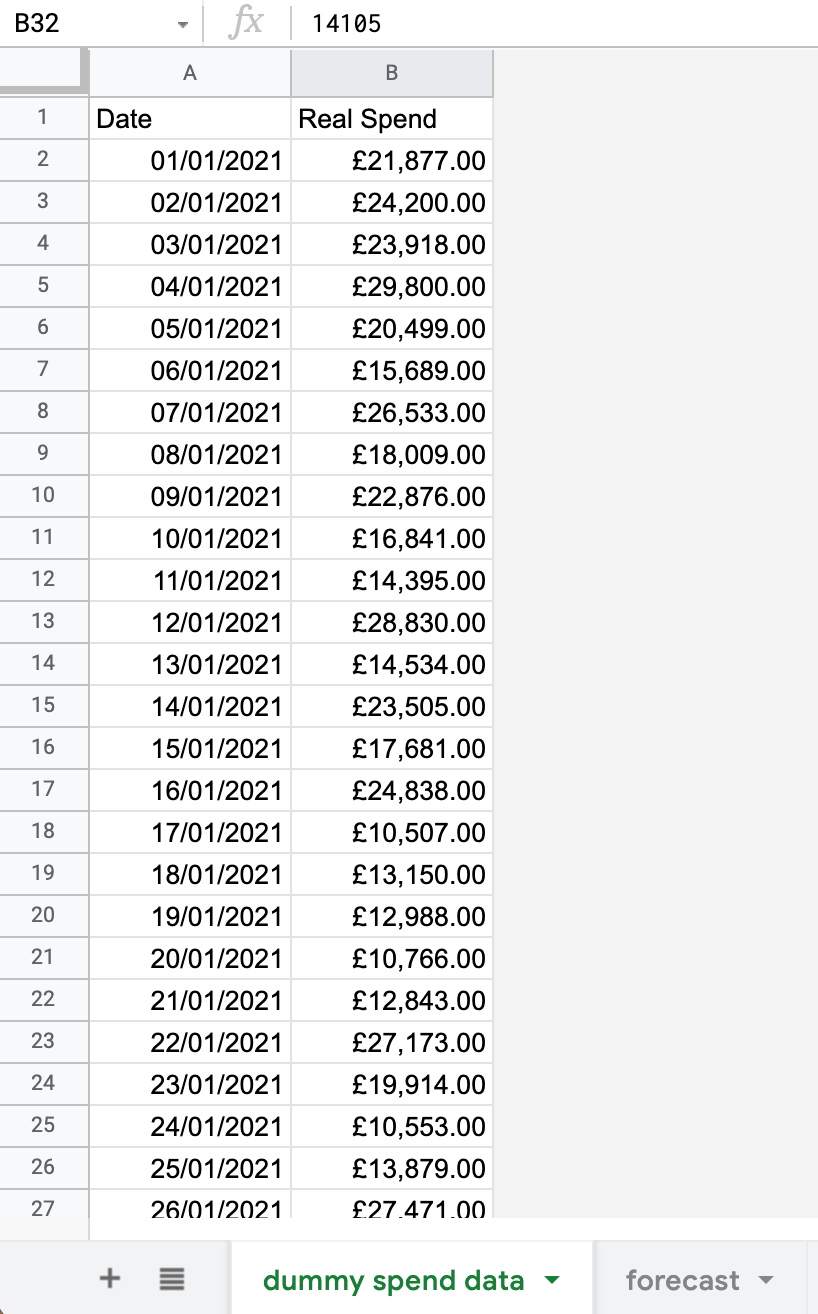
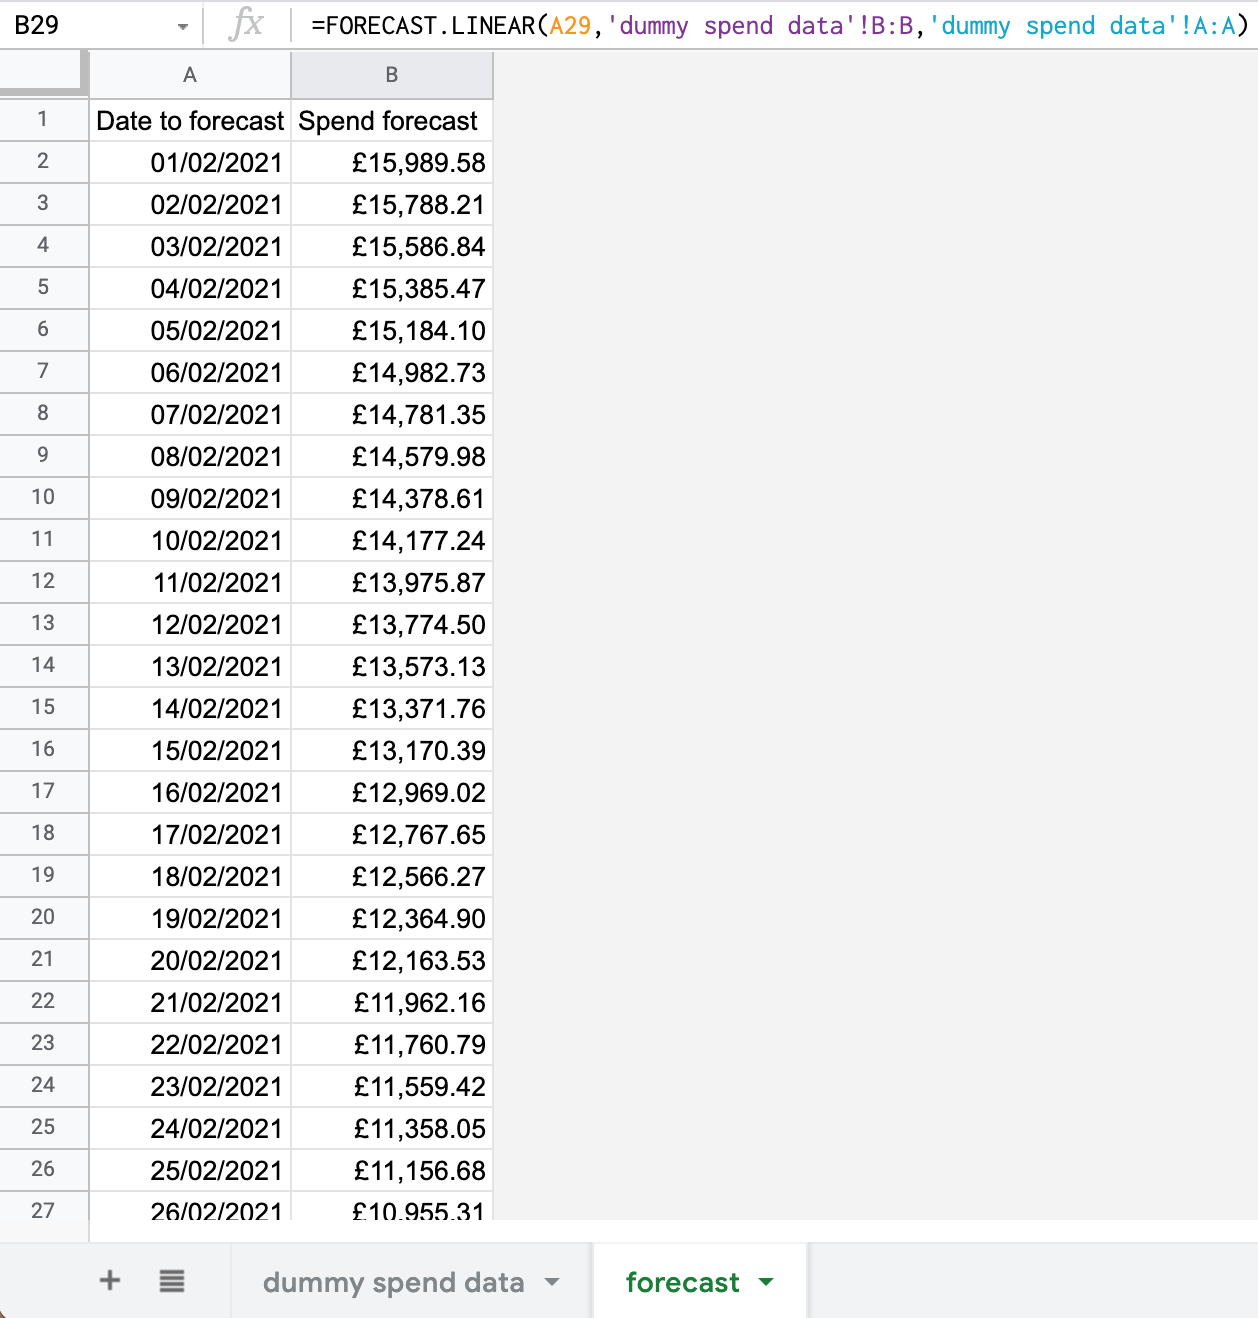
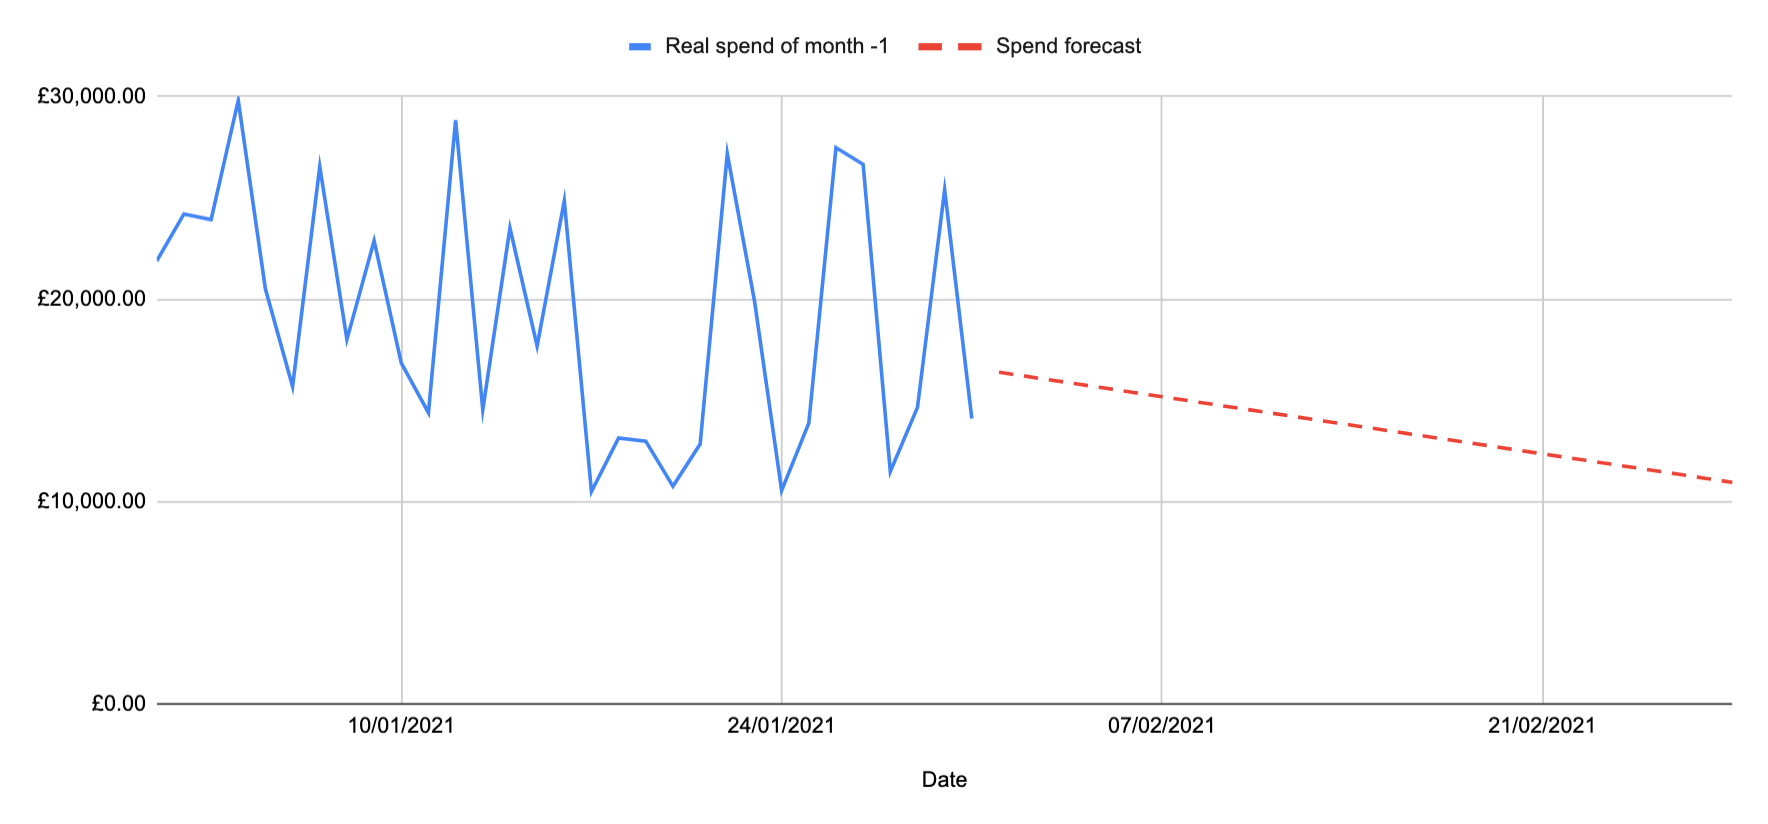
From there, it’s getting hard to explain the forecast especially why we are lowering our budget (with, apparently, no reason). It then became more obvious when comparing to the real spend of the year before. That’s because the forecast function is based on a linear regression.
I then decided to add a bias by using Google Trends. I extracted the monthly variations of search for the very top keyword we are bidding on to get a rough trend:
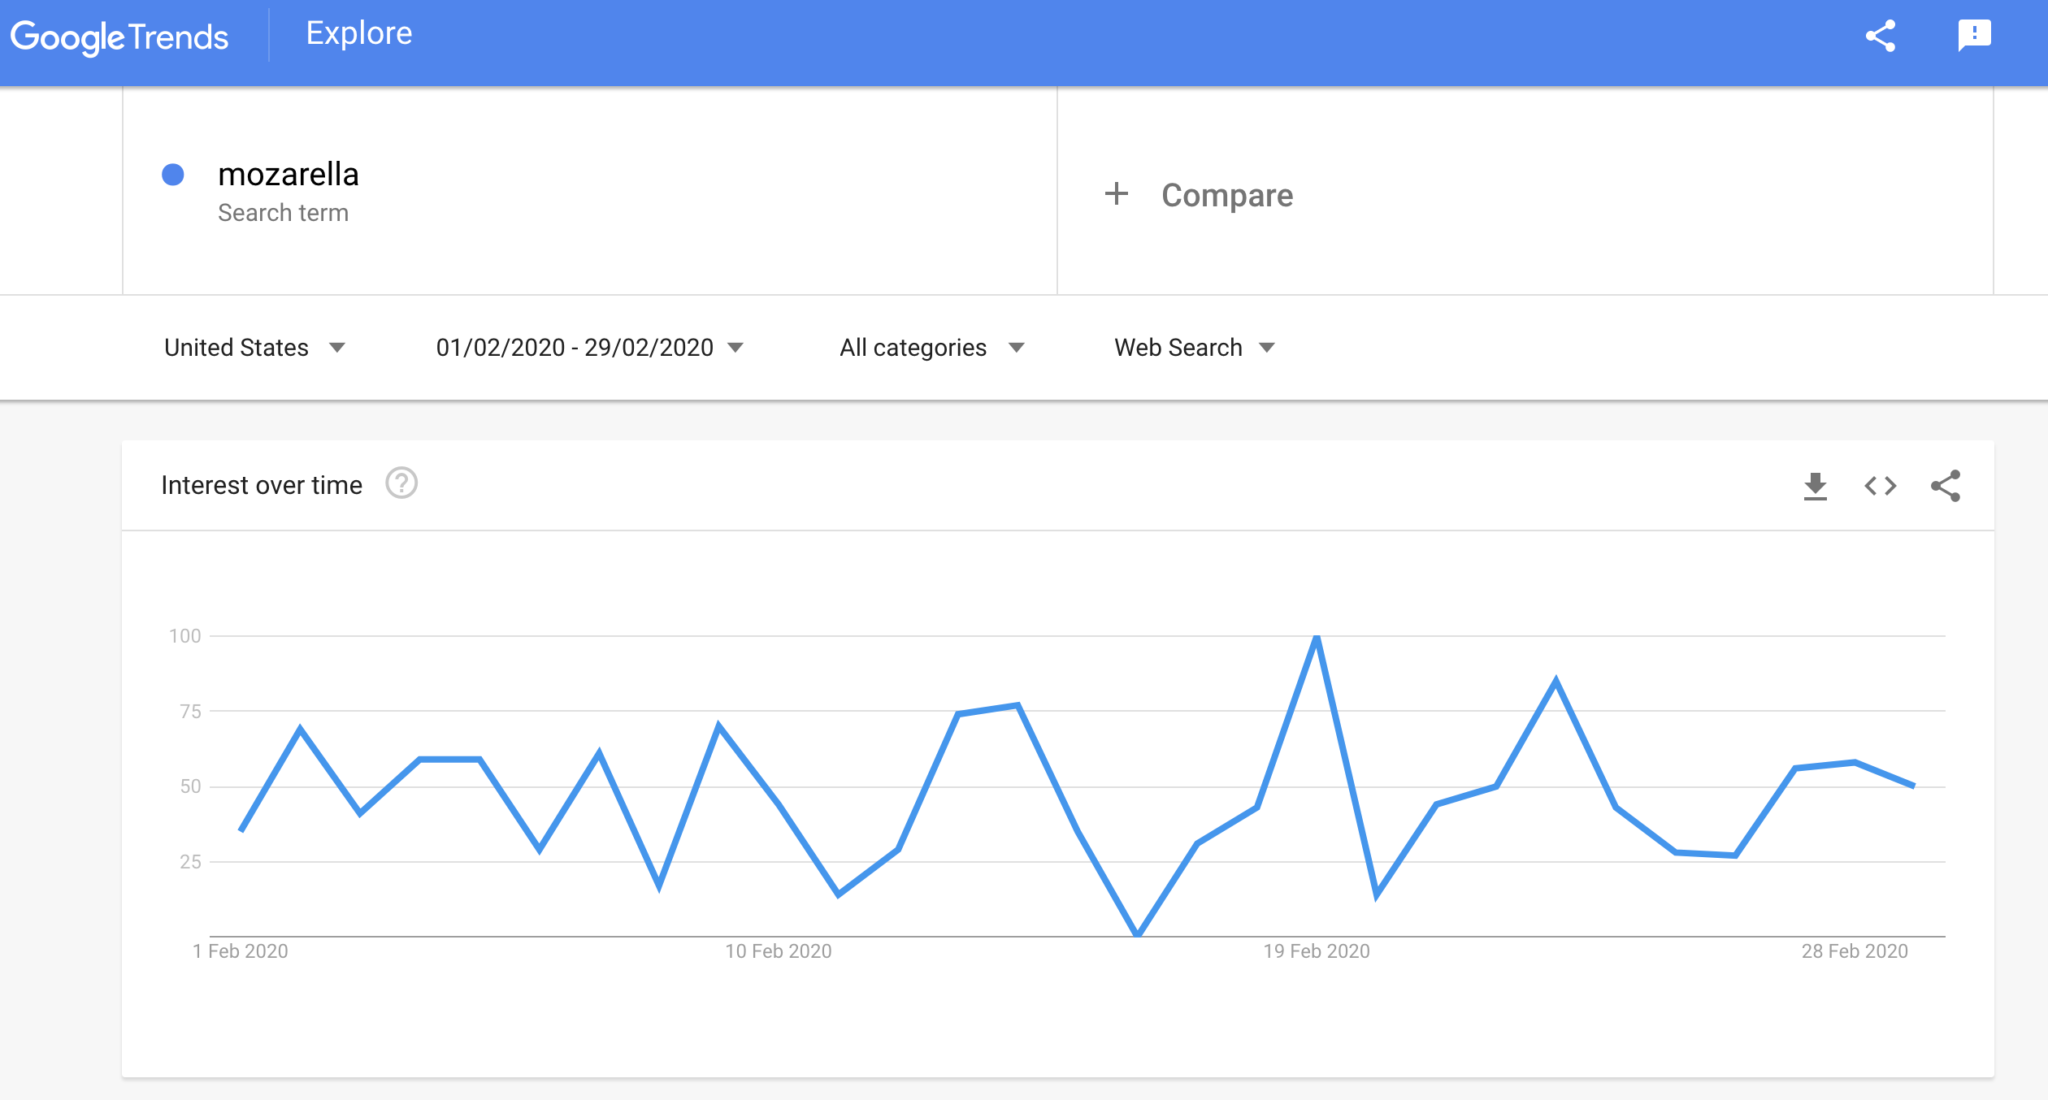
I extracted it and imported the CSV in Sheets. Then, I changed the raw data into percentage to add it in my formula:
=FORECAST(A2,'dummy spend data'!B:B,'dummy spend data'!A:A)*trends!C2Now, we have a forecast (yellow curve) that feels more realistic:

Then, I ran this formula on months that already exists to measure its relevance: I had $3K of spent difference in average when comparing the monthly amount of marketing expenses. Still, I lacked a lot of information to feel more comfortable with my forecasting: the probability of it to happen, the search trend, the external events that can come up as well, etc.
#1. Takeaway
By forecasting the past, you are able to measure the significance of your forecasting method.
Using statistical formulas straight from Google Sheets
From now on, we will be using a few statistical concepts to refine our forecast and learn how to foresee uncertainty.
As getting into statistics is not that easy, I highly recommend to read Probability and Statistics from Michael J. Evans and Jeffrey S. Rosenthal from the University of Toronto or enroll for the free MIT course (18 weeks long) on edX.
We want to feel more comfortable with our forecast so we need:
- Confidence.
- Probability of forecast to happen.
- Moving average to smooth our forecast variations.
Good news is that we have all the proper formulas in Google Sheets, respectively:
#2. Takeaway
By using statistical formulas, you are able to eliminate (or, at least, reduce) outliers.
Add external data to enhance your forecast
Still, we also need to predict future demand and anticipate days when business may be underperforming. Basically, here’s the big picture: among our traditional data (historical data, search trends and forecast) we have nothing left to refine our forecast.
We would like to quantify the uncertainty we will be facing:
- Search trend can drop off suddenly as well as rise to the top. Comparing to the year before can make no sense (such as looking at the search trend for certain keywords in 2020, year of the global pandemic that added bias at some point).
- A new player can enter the industry and then level up your competitor level in addition to your average spend, bids and so on.
- Climate, political and economics events can also have an impact on your business.
So here comes the fun into looking for external datasets; big enough to cover your needs in terms of additional data.
Pictarine’s primary market is located in the United States and we are sometimes hit by external events such as the weather.
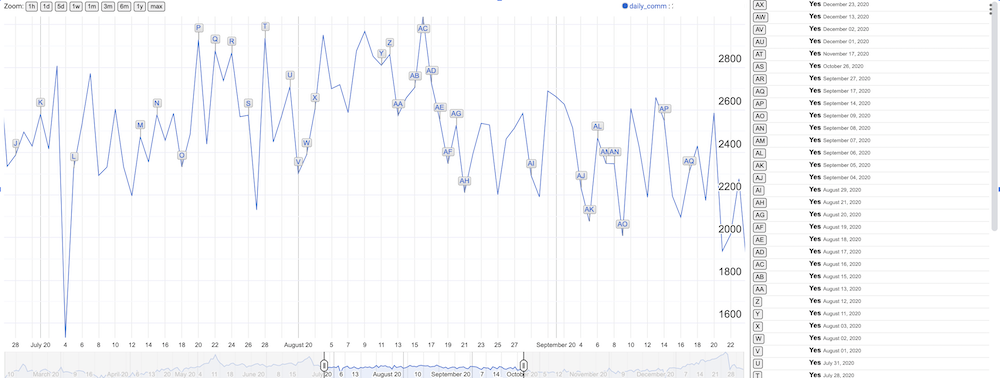
To understand the impact of such events but also to put a probability on it in case it happens again, I’ve had to download a dataset from Kaggle to get all the data about the California wildfire incidents. If fires come too close to our biggest cities (in terms of revenue); then it can have a pretty bad impact.
The funny thing is that I easily found patterns in this dataset; so it was then easier to put numbers on future probabilities.
#3. Takeaway
Even if you find the perfect formula to run your forecast model, you won’t be 100% close to the reality (and in any way you will). Adding external datasets to gauge uncertainty in your forecast will help you forecast different hypothesis for different scenarios.
Forecast model on Google Sheets
On the first Sheet, you can copy paste your own data such as marketing spend, traffic, sales, etc. On the second one named Trends, you can copy paste the values from Google Trends related to your industry or top keyword in order to get the seasonality.
Forecast
The first Sheet gives you the forecast obtained thanks to the linear function as well as the forecast model ran with the trends.
Forecast with scenarios
On this sheet, you have three scenarios to activate depending on your own data: optimistic, conservative and negative. Click on a checkbox to activate the proper forecast model.
Forecast with weekly seasonality
For some businesses, office days are well different from weekends. You have here the ability to run your model based on this daily / weekly seasonality.