Log file analysis with Search Console data

Let's start with my favorite tweet of all time: the one from John Mueller in April 2016:
@glenngabe Log files are so underrated, so much good information in them.
— E-e-eat more user-agents (@JohnMu) April 5, 2016
I did tons of log analysis especially while working at Oncrawl and I can tell you that if you're not looking at your log files, you're missing something (ndlr. depending on the number of URLs of your website. It makes sense once you have an important volume of URLs.).
Introduction to the crawl stats report
The Search Console team released the crawl stats report in November 2020 to help users better understand how Googlebot crawl their site. This was an excellent addition to the Search Console to get a first overview of your log data. As usual when we talk about the Search Console; it's sampled (URL details) and it shows the last 90 days only. Plus, this report is hidden in the Settings section... a mystery to me!
Despite this, I love it because it gives a chance to every user to access this kind of data. Having access to your log files can be harsh sometimes (depending on where your data is stored, if you use a load balancer or not, if devs are willing to grant you access, etc.) and here, directly in Search Console, you can get a nice overview. So you don't have to process and parse any log files!
Bonus: you can find an information that you can't find in your log files: the crawl purpose (refresh or discovery)!
Common usage of the crawl stats report
To help me build the (Looker) Data Studio template I had in mind to facilitate the analysis of these data, I ran a poll on Twitter to collect feedbacks about the usage of this report.
Hey #SEO! I need your help for my next article!
— Alice Roussel (@aaliceroussel) November 28, 2022
👉 How often do you use the crawl stats report from Search Console?
It seems that the overview is sufficient for most of the respondants. Still, it's difficult to navigate (you can't look at the status code breakdown all at once for instance), there's no possibility to run cross-analysis and you can't use filters to focus on specific URLs for instance.
I find it really tricky to navigate and it does not allow me to slice the data how I want it (by URL or folders)
— Lidia Infante (@LidiaInfanteM) November 28, 2022
This report is also used as a way to verify the quality of the log files you have (smart and reliable way to do so!):
to see if there's any mismatch between our server logs and Googlebot requests. (weird setup & too many layers between Googlebot and our site)
— Emirhan Yasdiman (@emirhan) November 29, 2022
Questions you can expect to answer
Export data from the crawl stats report
Well 🥲 To put it simple:
- This data is not available through the API.
- You can't export the data all at once.
So... you have to click on Export a lot:
- On the Summary (it basically export all the data you can see on this page, ordered by sheet).
- On the crawl request breakdown: by response (click on each status code to export), by file type (click on each file type to export), by purpose (click on each to export) and by Googlebot type (click on each to export).
Now that you've completed the export step, you understand how complex it is to gather all the data!
Valentin Pletzer created a nice Chrome extension to help with the crawl stats export but it doesn't include the URL samples (something I wanted to get access to in my Data Studio).
Log analysis from crawl stats report with Looker (Data) Studio
Store your data in a Google Sheets
Google Search Console make it easy to export in a Google Sheets. Still, you will have to reconcile everything in a single file in order to access it more easily once using Looker Studio.
Merge the following sheets:
- Summary crawl stats chart to merge in Summary
- Table by status code to merge in Status code
- Table by filetype to merge in Filetype
- Table by Purpose to merge in Purpose
- Table by Googlebot type to merge in Googlebot
Once you done that, everything is merged in the Status code sheet using a Vlookup function to get the Filetype, Purpose and Googlebot type for each URL. Because data by URLs are sampled, you will end up with a lot of #N/A unfortunately.

I added two bonus columns: protocol and first path. The first one to get an additional information and the second one to segment your URLs more easily once in (Looker) Data Studio.
Make a copy of the report
Please, read the following! I always receive emails asking for edit access to my Data Studio templates... Once you access the report, make sure to make a copy of it (both the Google Sheets & Data Studio templates).
Prepare your data
Once you created a copy of the Google Sheets template, make sure to rename it properly (from "Copy of Crawl Stats Report Export - Make a Copy - Merci Larry" to "Crawl Stats Report Export - Make a Copy - Merci Larry"); otherwise, the connection with the data source will be lost on Data Studio.
Then, copy paste your data in the Google Sheets. Your setup is now finished!
Template sections and common use cases
Summary crawl stats chart
They are the information you get at the host level in your Google Search Console account. The number of total crawl requests can be used to verify your log data in case you're using another tool to analyze them (such as Oncrawl, etc.).

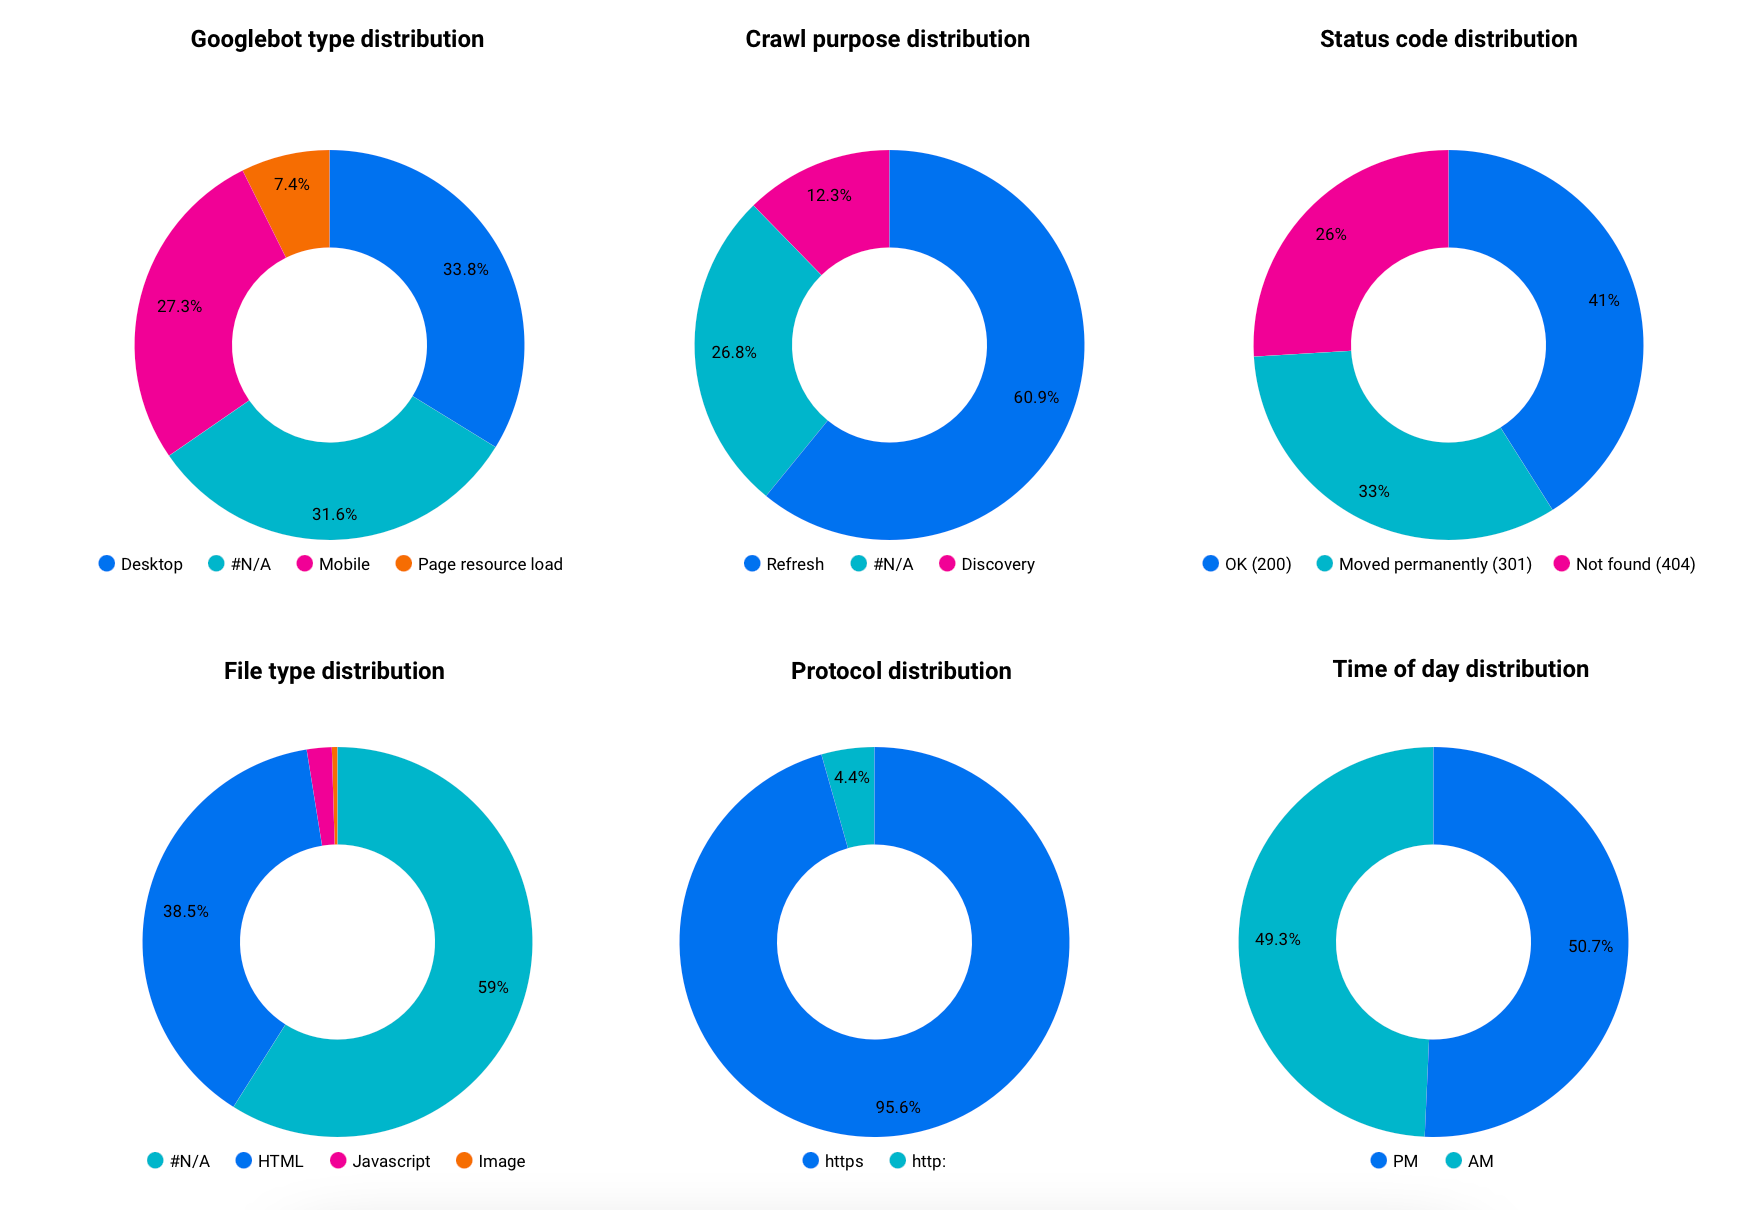
Googlebot type distribution
You can easily see the proportion of requests made by the different Googlebot. It's interesting to track this distribution overtime to see any change, especially if you're still primarily crawled by Googlebot Desktop and expect to see some changes regarding your recent optimizations.
Crawl purpose distribution
This is my favorite information from the Crawl stats report; and the one you can't directly have from your log files! So depending on your site vertical, you will probably expect to see an higher percentage of Refresh or Discovery (media, classifieds, etc.).
Status code distribution
Probably one of the most useful metric! There are a lot of actionables from there such as: tracking your 404 to redirect them or use a 410 (based on a test case while working at Oncrawl, it tends to be less crawled than 404 à priori), track any wasted crawl on irrelevant URLs, etc.
File type distribution
Depending on your site vertical and technology used, this information can be very precious. Thanks to this, I spotted an issue in my robots.txt preventing Google from crawling our images for instance 😅.
Protocol distribution
By now, you're probably using the HTTPS protocol on your website and if you're not, then you should! Sometimes, some redirects can get lost (redirect loops) or simply forgotten. Also sometimes, you can see that Google is just crawling some old URLs.
Time of day distribution
My first use case using this information is to give an important information to web developers regarding times of day when it's ideal to push in production. This information can cover many other use cases such as type of pages crawled at a certain time, type of Googlebot crawling at specific times, etc.

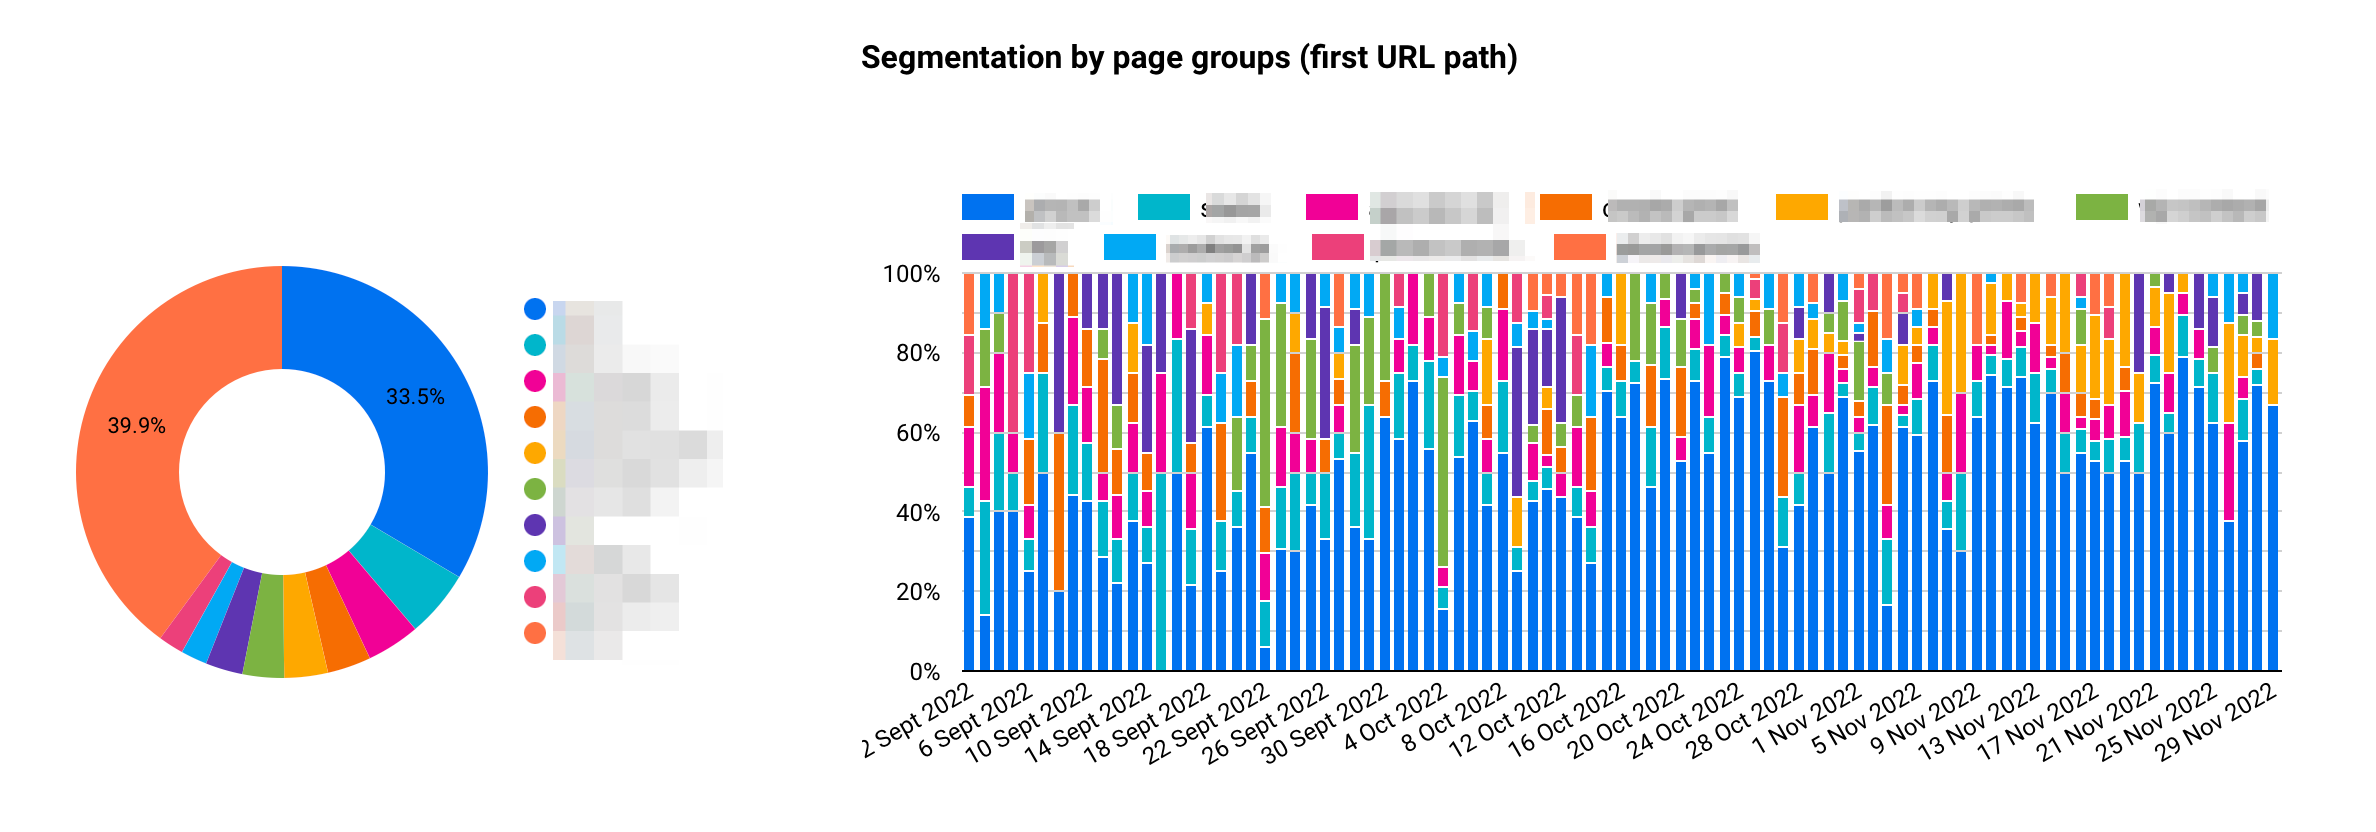
Segmentation by page groups (first URL path)
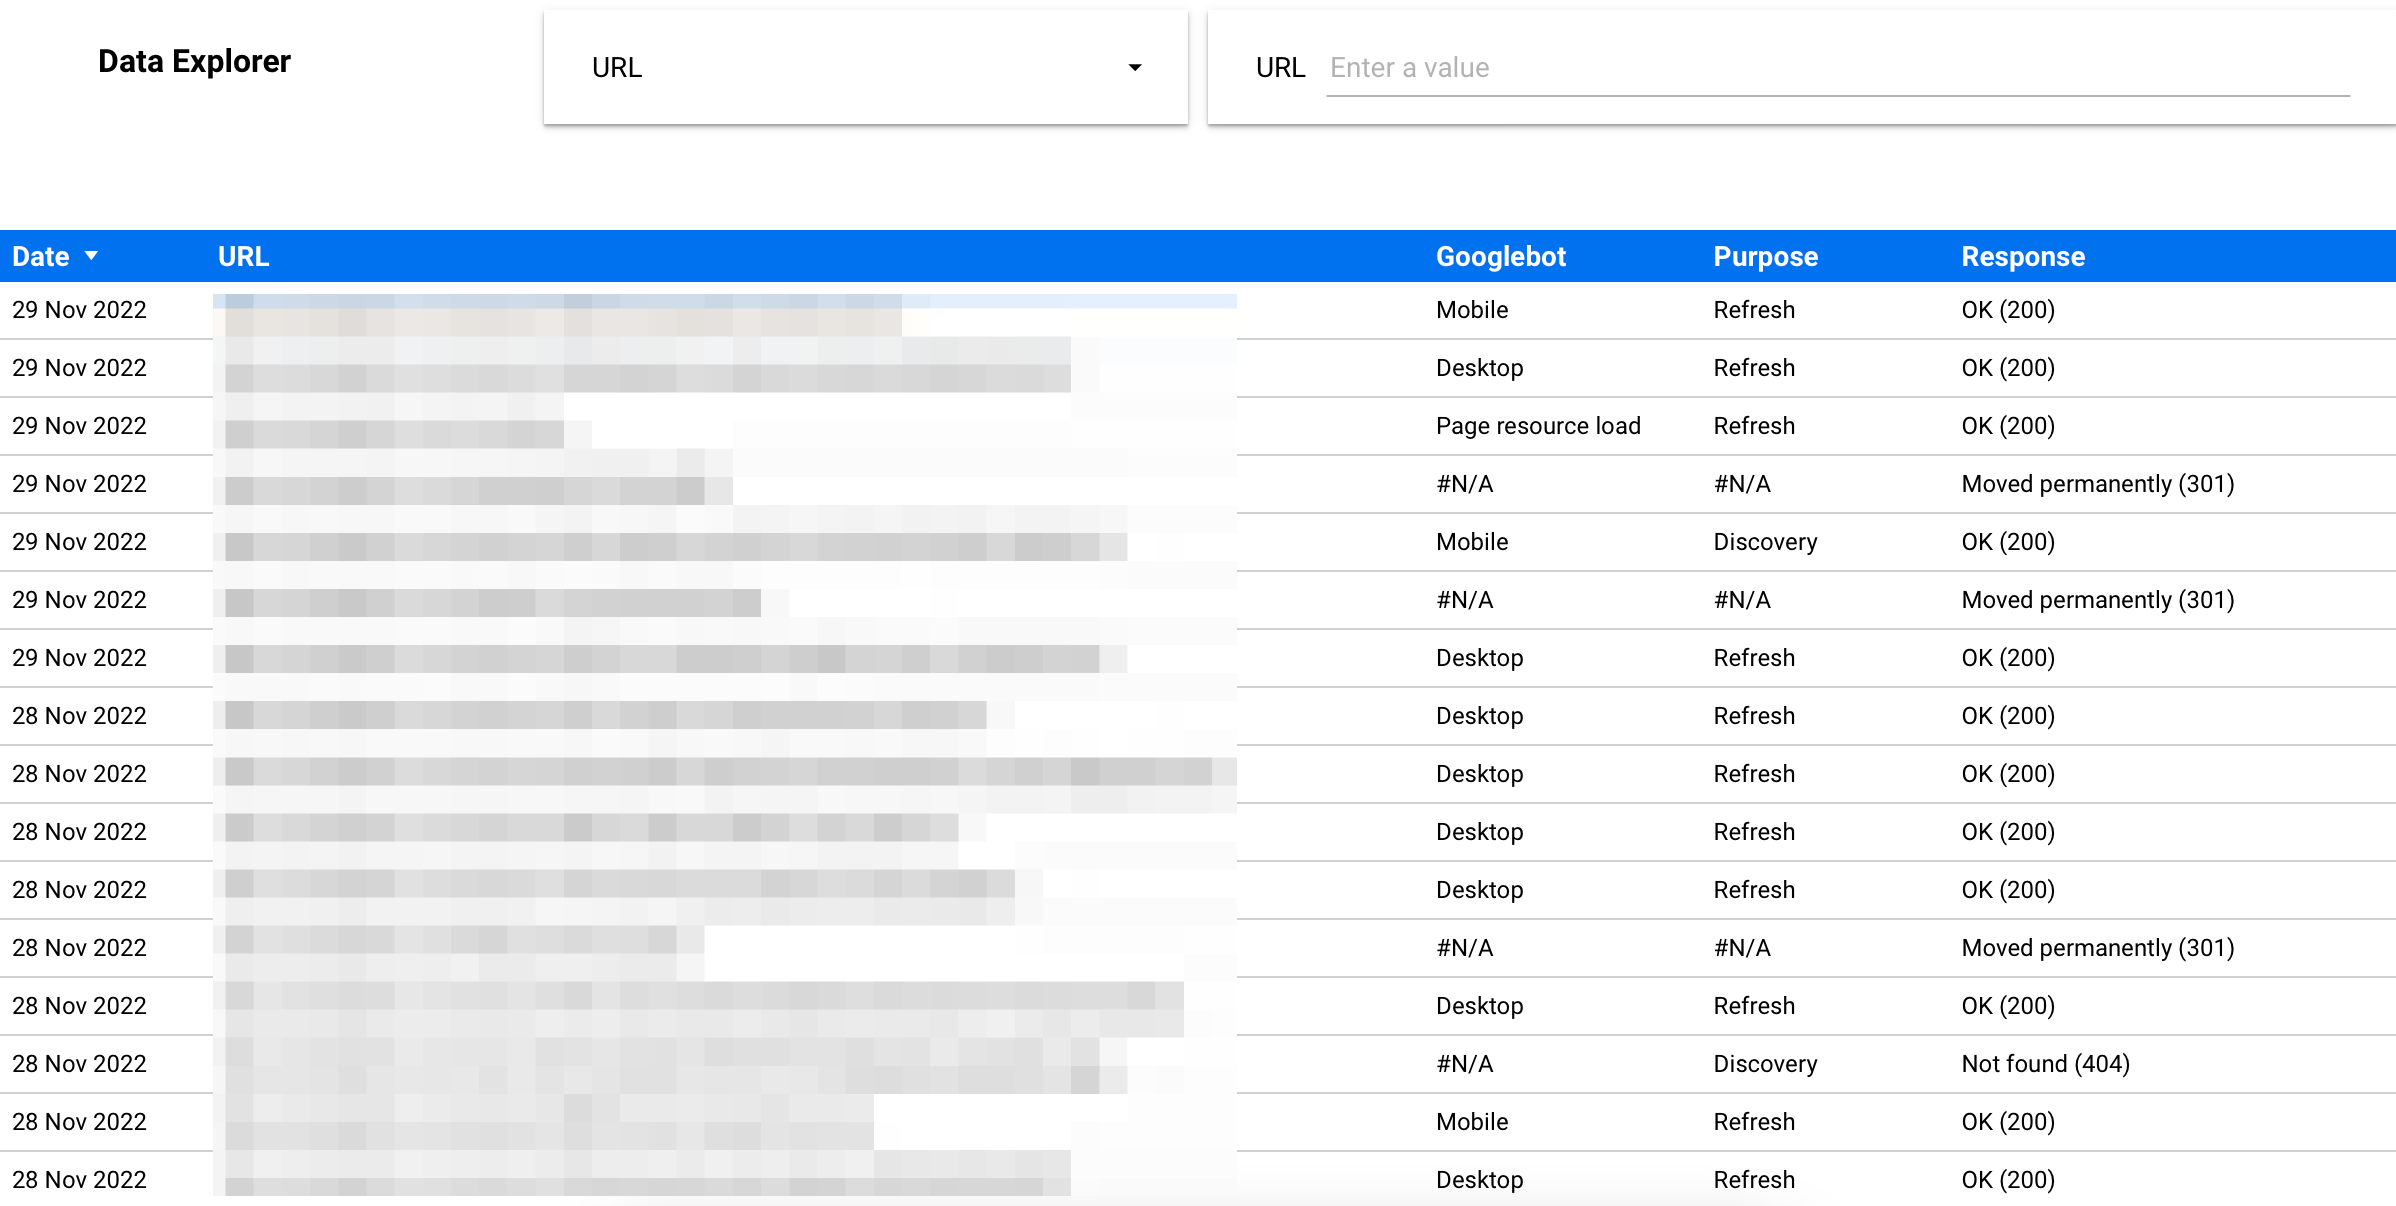
Probably something that's missing in the original Crawl stats report on Search Console: the ability to read your data by group of pages or by URL (see Data Explorer).
In that case, you want to run a cross analysis between filters and group of pages such as:
- Which Googlebot crawl this group of pages / templates?
- What is the status code distribution for this group of pages?
- Discover the crawl purpose for a specific group of pages.
- Etc.

Googlebot type and crawl purpose by day & Protocol and Status code by day
Now that you've seen the distribution, you can easily track any changes over time by using the date provided by the export. Also, by using the filter by URL at the bottom of the report, you can select one or several URLs and analyze more specifically the results.


Data Explorer
Easily filter by URL by typing the one you want to focus or on selecting multiple URLs from the dropdown option.

Changelog
This first draft lacks some interesting information that I would like to add in the future such as a filter by host, archiving the export so you can look at more than 90 days of data, etc.