Learnings from log analysis

Almost two years ago, I joined OnCrawl and the opportunity to access millions of log data: the feeling of entering a tiny Google with access to lots of crawl data, logs and third party connectors.
In this new article, I would like to share my learning about log data. There is now a lot of talk about data science, a field that relies on logs for their reliability, but this subject still remains in the shadows, despite its already demonstrated interest.
Log files: the grand introduction
Without going into the details and the breakdown of a log line, we will remember that it is a data that doesn’t lie: written in stone each time a crawler comes and each time your users visit the site. The log line relative to an organic visit is then more robust than an analytics tag that might not be triggered for x or y reason.
Log data does not lie but can be inconsistent if not handled correctly. We will discuss below the essential quality control to be provided at the time of their retrieval.
Although the data in each line is valuable, it involves less flexibility than other data sets in terms of cross-analysis.
If we were to categorize them, it seems there are three kinds:
- Visits from your users.
- The traces left by the crawlers.
- Errors in your infrastructure.
The first one is more reliable than your Analytics trigger, as we saw above. The second one is a bit like the grail of the trade: traces, unconnected and unrelated to each other, that allow you to better understand how Google interprets your website. The third is, compared to the first two, less attractive, but it sometimes has the merit of confirming certain hypothesis, as we will see later.
In short, all these data are recorded every second and allow the past to be reconstituted:
- the page visited,
- response time: although typically to missing subscribers, response times are important, as you can imagine. They provide a measure of how long it takes for Google to access the page: sometimes it can take a long time when it’s the robot that triggers the cache,
- the response code,
- the origin of the visit,
- the name of the user agent: we can break down the crawler’s visits between desktop and mobile at first but also according to the verticals: images, news…
- localisation via IP: the IP address allows to verify that the fingerprint comes from a “real” Googlebot (or a robot from another search engine): we sometimes uncover heavy consumption of resources by robots that would like to pretend to be more famous than they are …!
- date, time and time zone: if we analyze data over large periods of time to try to identify trends, access to the raw data allows us to look more closely at the number of times a robot has passed through in a short space of time (one minute for example) and thus measure the speed of exploration.
Quality check: one file sometimes hides another one
That’s the complexity of log files: you have to identify their location, check their consistency, and find a way to retrieve and process them day after day. Every website infrastructure is different, so the locations are not always the same. Worse, the very composition of a log line may differ depending on the service you are using. Some clouds provider, for instance, fail to retrieve the response time, others replace the original IP addresses with their own … while others simply refuse to give you access to your log data. In short, this first job can be an extremely complex task between data recovery and data processing.
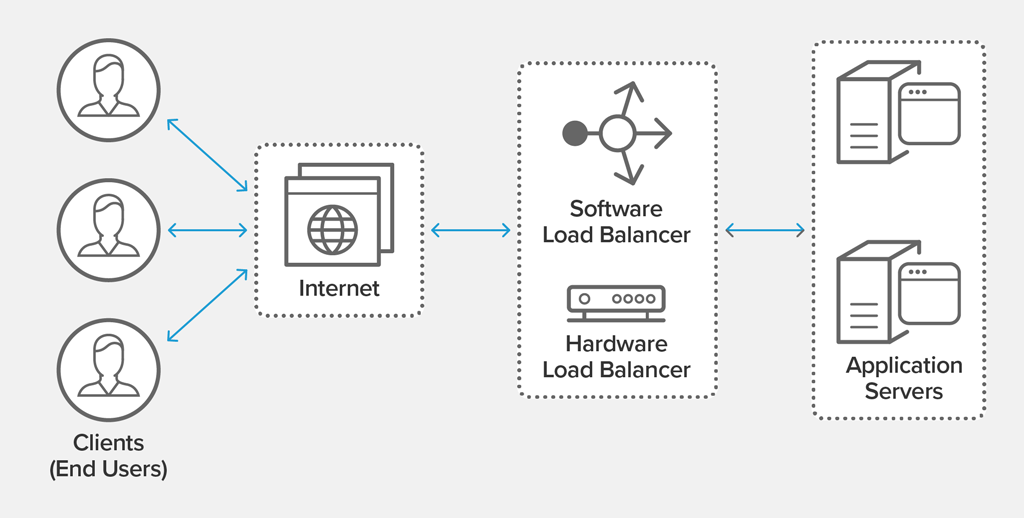
On the dock, we can easily call the load balancer (load balancing). Behind this harmless name is an algorithm capable of using a C server rather than a B server to guarantee an optimal response time to the user, or crawler.

The hard facts
Early 2017, Google released an article on its official blog for webmasters to bring the concept of crawl budget. Although the data differs according to business sectors and site typologies, it is true that Google’s crawl is made without a hitch for small sites. This is all more true when the sites are built on known and widely used CMS since the logic behind the URL structures are, more often than not, similar. Google, like other search engines on the other hand, easily discovers URLs and explores them easily.
At the opposite, for websites that contain hundreds of thousands or millions of pages, crawl budget optimization makes sense. And it is with this data that we have the most fun. We will see in the second part of the article how to optimize (really) the resources deployed by search engines to explore your site.
Another proven fact is the spider trap, those famous infinite exploration traps, which are a real plague. If the crawler can stop at any given moment, for lack of finding an ounce of quality, the fact remains that such an element deteriorates the general quality of exploration and the will to identify new contents quickly.
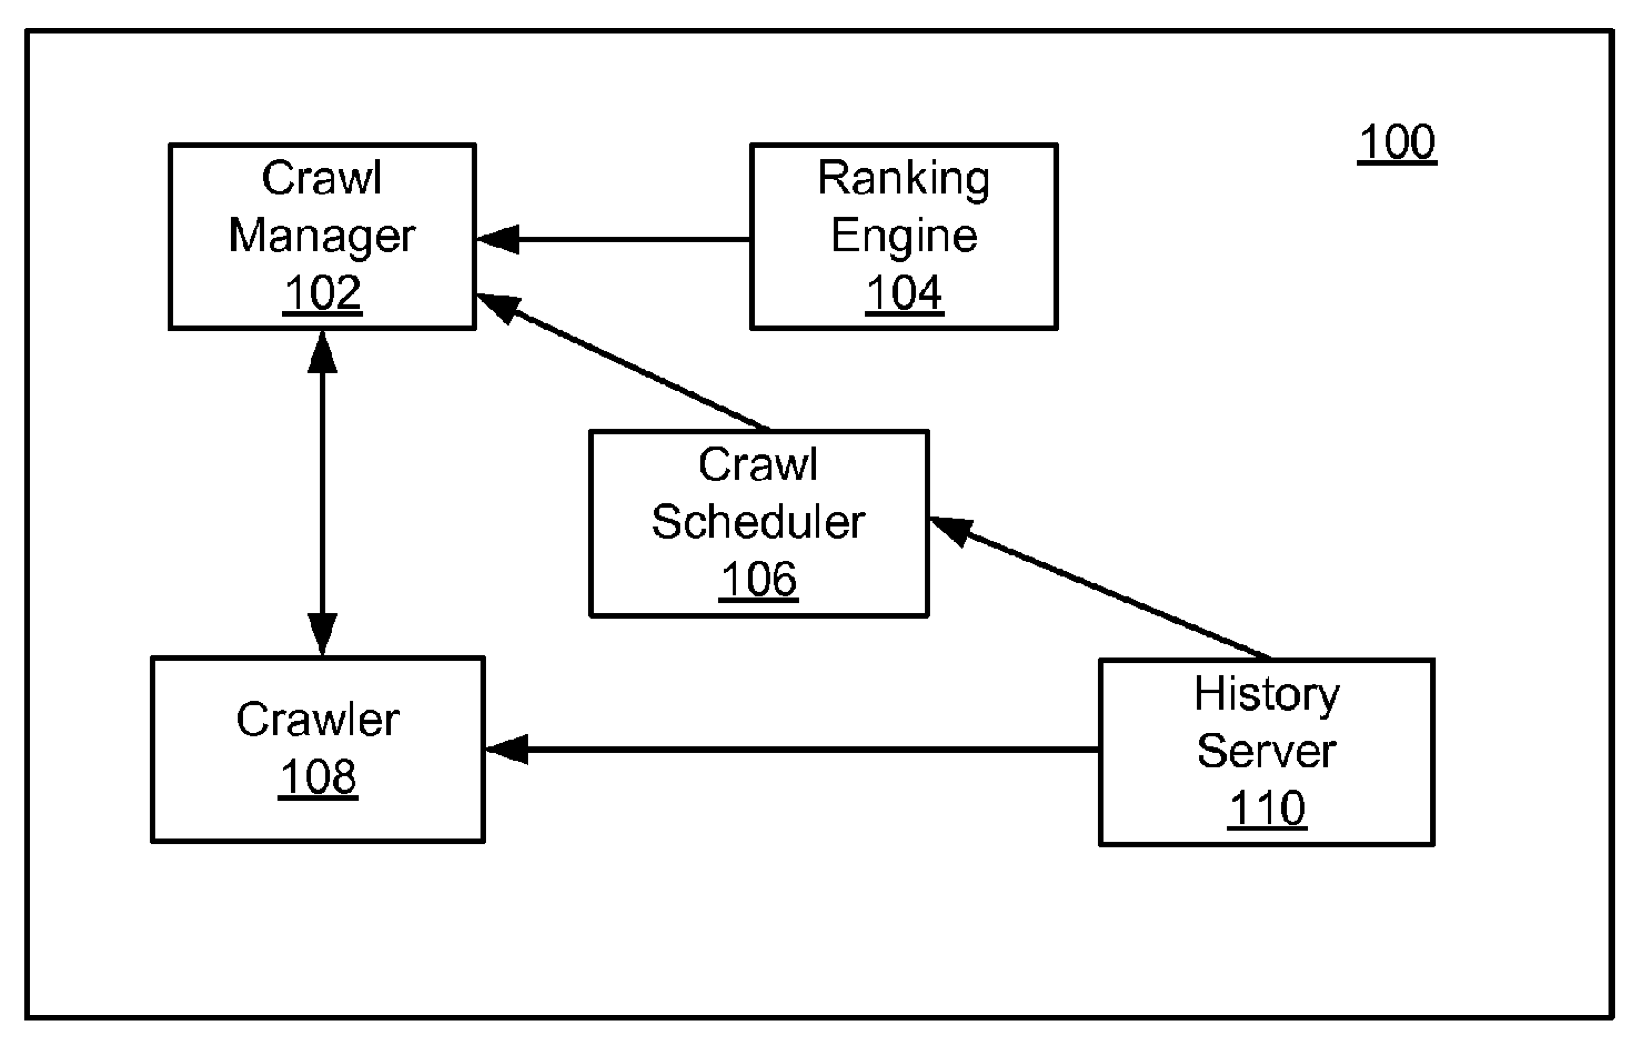
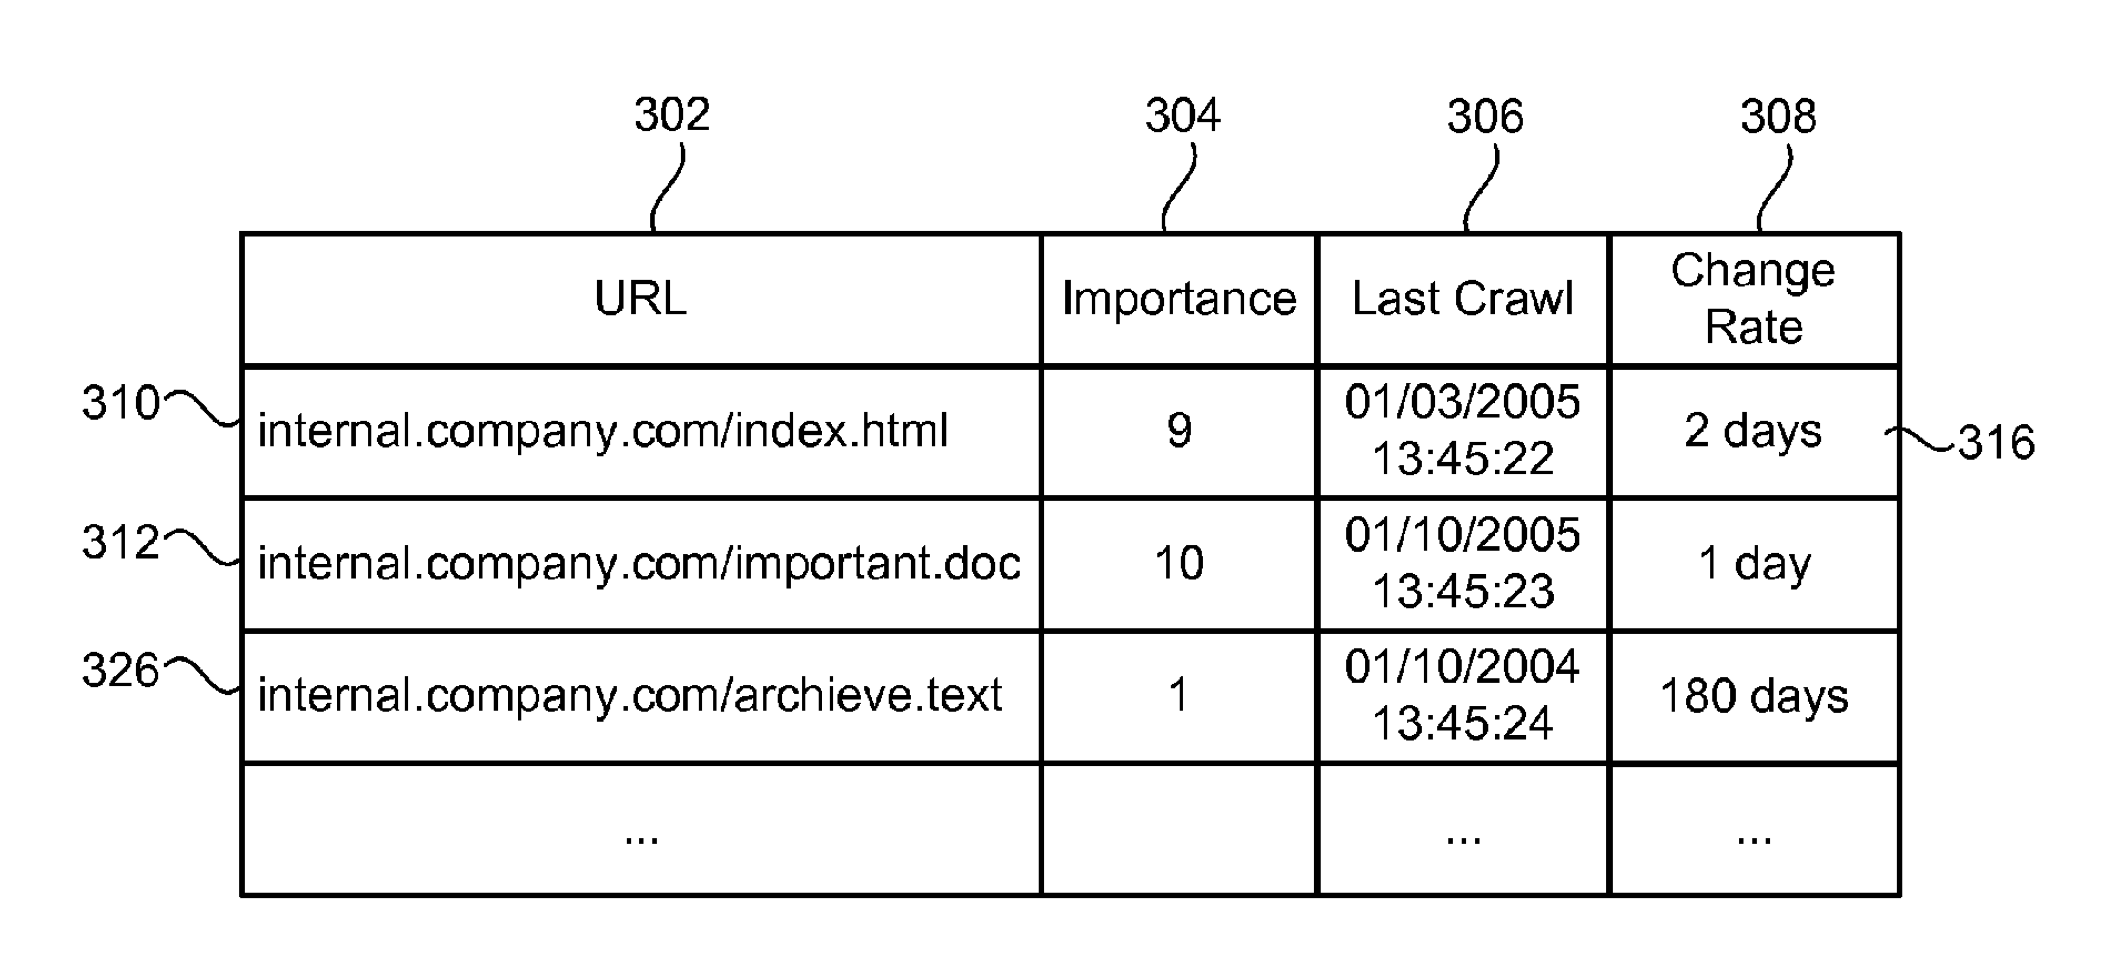
Finally, we will focus on THE fact that will please purists: the crawl scheduling according to the importance score in particular. These pitfalls can be found in two Google patents, the first of which deals with the management of URLs.

This is a perfect illustration of the crawl scheduling of a page, i.e. its crawl frequency, according to its importance score. This planification can be based on the Pagerank as it can also use, depending on the relevance, another ranking algorithm. Figure 3 shows us the number of pages included in the index according to the importance thresholds, while figure 4 shows us the maximum limit of pages to be entered in the index (full line) and the target limit of pages to be entered in the index (dashed line).

This analysis is more generally performed in a page group logic that makes reading more flexible. Depending on the type of site (press, classified listings, etc.), we find similar crawl schedules although weighted by page volumes and positive and incidences signals.
The findings
The need to check the accuracy of the data gathered so as not to bias the analyses was mentioned above. De facto, one would tend to want to compare the curve of the pages explored by Google with the curve available (unfortunately it remains) in the old report of the Search Console: exploration statistics. For sites whose acquisition channels are not very diversified, it works. For others, it is a challenge. Indeed, at OnCrawl, we discovered (thank you Nicolas!) that the curves are similar only when you take into account all the crawlers, which we call vertical, and not only the SEO data. This implies that the crawl budget must be seen in a broader way: include all user-agents and not only those we think of in general. Another hypothesis being studied today is the possibility that this curve, on the GSC side, is based only on canonical pages (which would make sense given the latest updates of the tool in terms of counting clicks and impressions).
This finding makes it all the more necessary to rely on an independent log analyzer in order to correctly decompose the path of each crawlers. Indeed, we can quickly make our data said what we want, even more so when we don’t know for sure what they contain.
The other items to be revealed
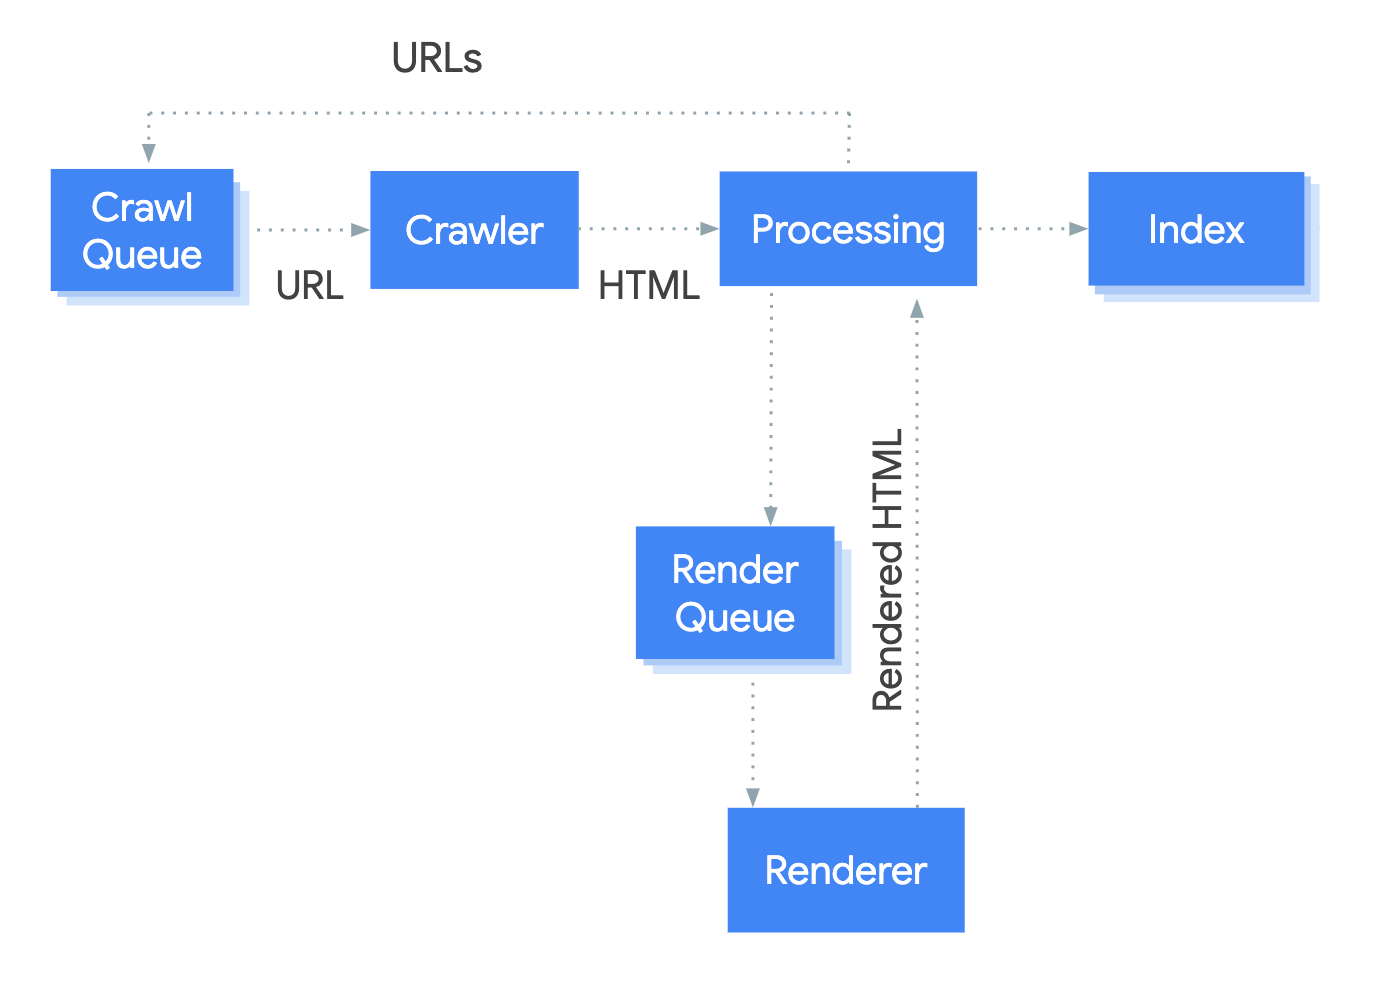
Unsurprisingly, we can find Javascript again. Google gives us indications (especially during the I/O 2018 event) and also gives us a schema widely used (so I contribute to the loop) :

In the end, little is known about this queue and rendering engine, although we can identify crawl patterns in which a larger exploration need would include rendering.
It is easy to distinguish patterns in which Google performs a more important rendering, about every 15 days (for the analyzed site, of course). However, there is no direct correlation with a possible drop in SEO visits, which could have shown a higher consumption of resources on a given day.
Even more interesting, if we focus on a particular URL, we note that the different bots (seo and vertical) perform a pre-rendering. There is no communication between them: exploration is therefore siloed. Although this makes sense because each robot evaluates the quality of a page against certain criteria, it may surprise us because we could imagine that this famous communication channel would reduce exploration costs and therefore, ultimately, the costs generated by the operation of data centers. However, the first bot allows to reactivate the cache and thus reduces the response time for the following bots (which all intervene within 5 hours, for the analyzed data).
We have just mentioned above the need for exploration, which Google explains in these terms:
Even if the crawl rate limit isn’t reached, if there’s no demand from indexing, there will be low activity from Googlebot. The two factors that play a significant role in determining crawl demand are:
Popularity: URLs that are more popular on the Internet tend to be crawled more often to keep them fresher in our index.
Staleness: our systems attempt to prevent URLs from becoming stale in the index.
Additionally, site-wide events like site moves may trigger an increase in crawl demand in order to reindex the content under the new URLs. Taking crawl rate and crawl demand together we define crawl budget as the number of URLs Googlebot can and wants to crawl. Gary Illyes, Crawling and Indexing teams @Google
We note that this need is closely linked to the frequency of visits to the site, albeit with a time lag of +24/48 hours.
This is certainly the first criteria that allows to weight Google’s exploration: the latest defining itself as a good citizen of the web (thus not jeopardizing the performance of the site during high traffic). One could imagine that this discrepancy could be explained by the time it takes to update click data on Google Search Console: real data on which Google could base itself in order to adapt the allocation of its resources.
Log analysis, the real one
Understanding the data
The two graphs we have just seen illustrate the point perfectly: it is a question of understanding the origin of the information and the intricacies it may have between them (and with external elements) in order to understand their meaning.
The following terms are often used:
- Crawled pages: a page explored by a crawler. The values are often aggregated over a period of time (90 days allowing to get an idea of a possible trend).
- Bot hit: a page crawled by a crawler at a time T, which may occur several times a day for instance.
We find the same logic for the resources and, for both, detailed information about metrics such as loading time, response code, etc… (which we saw in the introduction at the end).
Then, often neglected in favour of audience tools, we find the SEO visit, which provides information on the total number of organic visits.
How to interpret these graphs whose variations are daily?
Some of them can be explained with the different resource allocations as we saw earlier, but sometimes this is not enough to explain everything. Indeed, we know that the processing of pages is unequal, that it differs according to their importance score and is therefore subject to crawl scheduling.
The most often encountered difficulty is to create a view to distinguish between URLs that have added value and those that do not, which are part of the URLs that you do not want to see crawled.
It is understandable here that the more important exploration needs are concentrated on useful pages (note that this remains rare. Quite often, the opposite is true, with more useless pages crawled than useful pages). It now remains to be understood why these higher resource allocations take place at these particular times. I mentioned above the external factors: one must indeed read the data in relation to the dates of live release, important optimization and even more external event: the deployment of algorithmic updates which may lead to a more important but temporary need for exploration. We have seen this perfectly with the switch to Index Mobile First for the sites concerned.
Understanding trends
Let us evoke a current event that speaks to everyone: Covid-19. With the lockdown, we wondered if the Internet network was going to be saturated. Also, it was logical to think that Google, like other search engines, could reduce its coverage so as not to consume too much of this precious bandwidth.
Indeed, it can be observed that, over the period relative to global lockdown (the data being medians drawn by similar industries in several countries), the number of crawled pages has reduced with the exception of the media: not surprisingly.
If we observe in a more granular way two antinomic industries facing the headlines, we can quickly understand the trends observed between 2019 and 2020 for an equivalent period:
In fine, out of current events as significant, trends must be analyzed in relation to the cycles of your technical releases ( technical or batches of organic optimizations), which are often revealing. It is this work that allows you to better understand why such and such a robot behaves in such and such a way on your site.
Assay the assumptions
Like Google Analytics that gives facts, log analysis is always under many assumptions despite the quality and richness of the information. While log analysis allows for a more granular analysis, SEO is still an inexact science.
The cross-analysis makes sense in this chapter because the factors that deteriorate your organic performance can be easily prioritized thanks to the logs:
- A significant number of your pages are duplicated,
- But you also have a lot of orphan pages,
- With a redirection plan that didn’t go as planned and you have the majority of your redirect stuck in redirect chains,
- And your canonical tags have decided to make you dizzy: they no longer respond to your logic,
- And we could go on like this for a long time.
These facts that the crawl shows you can be quickly uncovered with the analysis of logs to determine which element(s) impact(s) the exploration of Google, Bing et al. the most.
Conclusion: test & learn
One thing we note: the log files are full of information, each one more important than the other: it is up to us to analyse them in great detail to confirm certain hypotheses, refute others and ask ourselves new questions.
At a time when SEO is favoured by some brands because of the current and future economic impact, but also because of the possible alliance with data teams, it is also time to dive into log data: accurate but also obscure and impartial. We have access to factual and tangible but still partial data to get all the pieces of the puzzle: for example, it is difficult to reproduce a crawl scheme because we don’t yet know how to define the T0 time nor how to connect the dots between the log lines: they are sometimes the result of different analysis purposes depending on the robot, etc.
We’ll end on this recent answer given by John Mueller: “there are no numbers”. No precise numbers or general average. Each analysis is different, that’s what makes log analysis so attractive. This is also what makes some of the graphs presented above naïve: there is no established truth but there are always good hypotheses.
This article is the first of a long series (I hope) because it is difficult if not impossible to summarize in one article what can be discovered through log data.